California’s Most Dangerous and Safest Cities for Drivers
 As a San Diego car accident lawyer who has handled hundreds of motor vehicle accidents throughout the state, attorney Scott Liljegren wanted to find out which California cities were safest and most dangerous to drive in. A new study by Liljegren Law Group and 1point21 Interactive examines the risks for drivers in the Golden State’s largest cities.
Our Study
In this study, we ranked all California cities with populations over 100,000 based on nine different metrics across two dimensions: motor vehicle collisions and contributory factors. Within these dimensions, we collected data and calculated each of the following for each city:
- collision rate
- fatality rate
- injury rate
- alcohol related crash rate
- speed related crash rate
- hit and run rate
- population density
- daily vehicle miles traveled (DVMT)
- infrastructure share: percentage of total accidents attributed to unusual road conditions and traffic control devices
- average annual rainfall
- percentage of young drivers (aged 15-29) vs total population
Key Findings
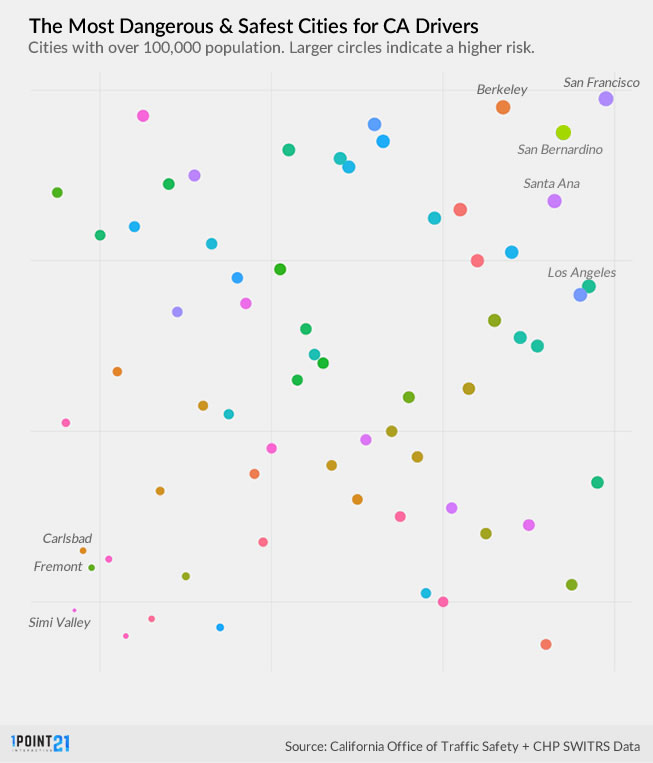
What’s the difference between a safe city and a dangerous one? On average, the 20 most dangerous cities in our study have significantly higher rates for all collision metrics analyzed, nearly 2 times higher than the 20 safest across the board.
NorCal vs SoCal. Southern California is home to 14 of the 20 most dangerous cities and 13 of the 20 safest cities in our study. Drivers in Northern California are at a slightly higher risk of bodily harm as NorCal cities averaged a slightly higher overall crash rate and injury rate than did cities in Southern California.
Wet roads make a difference. The 20 most dangerous cities receive nearly 4 more inches of rain per year on average than the 20 safest cities.
Youth and inexperience impacts safety. Drivers aged 15-29 were involved in 51 percent of all collisions analyzed in our study, despite representing just over 22 percent of the population.
Larger cities are more dangerous on average. The average population for the 20 most dangerous cities on our list was 406,463 compared with 234,753 for the 20 safest.
America’s finest city: San Diego is the 18th safest city despite having the second highest DVMT of any city. This means that despite being second only to Los Angeles in miles driven each day, San Diego drivers are crashing at much lower rates. Additionally, our analysis found San Diego to be the second safest of cities with populations of 250,000 or higher, behind only Fresno. San Diego also boasts one of the lowest overall crash rates of any city in our study as well as the second lowest rate of speed related crashes.
Study Results
The cities in our study accounted for 123, 512 total collisions, 749 fatalities, and 92977 injuries. Without further ado, here are the full results of our study, where a lower number indicates a more dangerous city to drive in.
The Safest and Most Dangerous Cities for Drivers In California
Note: 1 is most dangerous and 65 is safest.
[wpdatatable id=12]
*All rates are calculated per 100 million vehicle miles traveled (VMT)

Collision Dimension Detail
[wpdatatable id=13]
Fatal Crashes
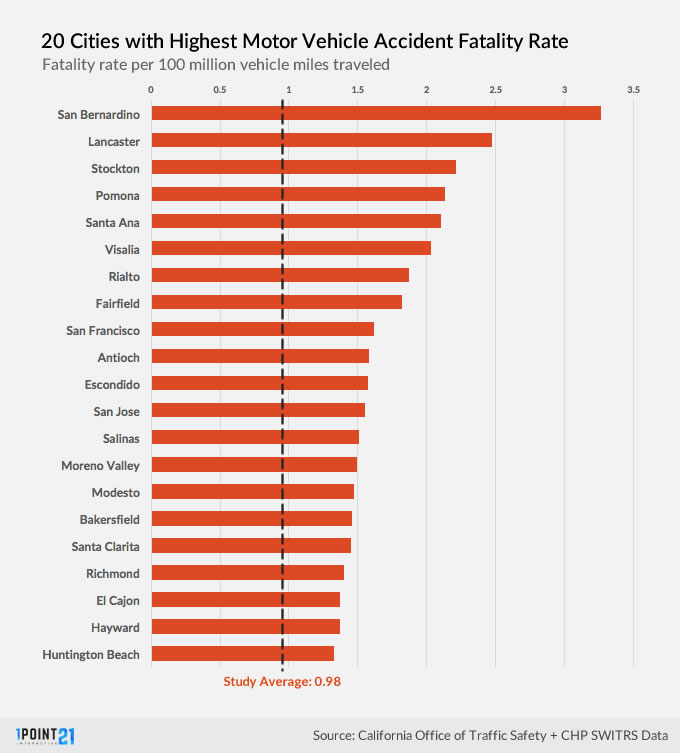
Six cities had fatality rates (rate per 100,000 million vehicle miles traveled) more than double the average of all cities in the study (.98). Leading the way was San Bernardino at 3.26, more than three times the study average! Lancaster (2.47), Stockton (2.21), Pomona (2.13), Santa Ana (2.10) and Visalia (2.03) made up the remaining five. 26 cities had fatality rates above the national average of 1.12.

Drinking and Driving
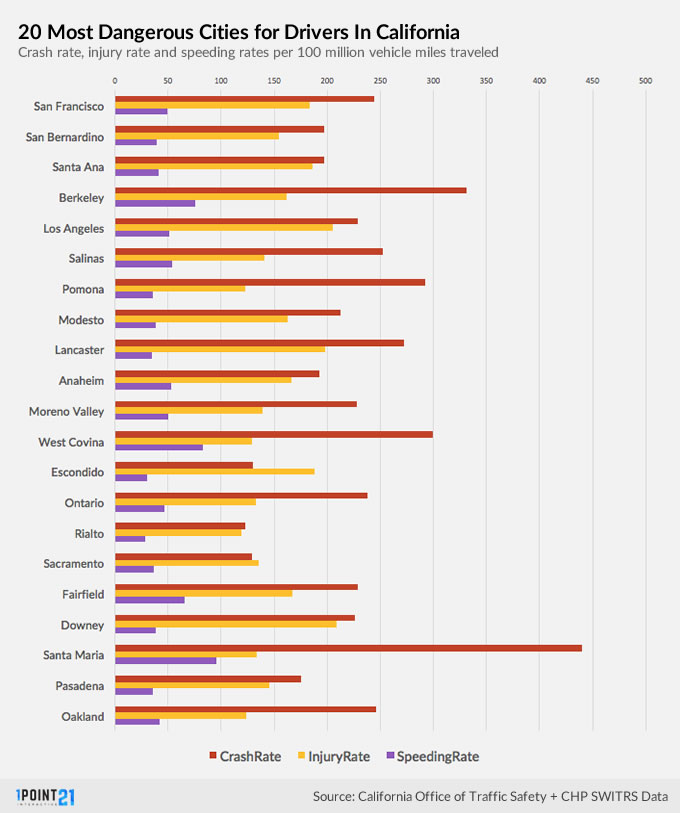
The five cities with the highest rates of alcohol related crashes are found in Southern California: Escondido (26.47), Downey (19.77), Santa Maria (19.48), Rialto (18.74) and Costa Mesa (17.73).
Unsafe Speed
In crashes where unsafe speed was the primary factor, Fontana (105.59) had a rate nearly ten percent higher than the next closest city, Santa Maria (96.0). West Covina (83.24), Berkeley (75.52) and Santa Clara (75.47) round out the rest of the top five.
Hit and Run
Two cities, Santa Maria (135.65) and Berkeley (124.88), possessed hit and run rates that were well above the other cities in the study. Los Angeles was the next closest at 85.88.
Contributory Factors Dimension Detail
[wpdatatable id=14]
Infrastructure and Its Impact on Driver Safety
Within the Contributory Factors dimension, we logged the number of collisions that occurred when an unusual condition was present within the city infrastructure. This includes the presence of holes or deep ruts in the road, construction, flooding, roadway obstruction as well as situations where the traffic control device was not functioning or obscured.
Methodology
We analyzed data across two dimensions – collisions and contributory factors. Within these dimensions, we identified and ranked nine metrics that affect road safety for drivers. Our dataset and rankings are a reflection of the following:
Collisions: Two-thirds of total score
- Overall Collision Rate per 100 million vehicle miles traveled (VMT)
- Fatality Rate per 100 million VMT
- Injury Rate per 100 million VMT
- Alcohol Related Collision Rate per 100 million VMT
- Speed Related Collision Rate per 100 million VMT
- Hit and Run Rate per 100 million VMT
Contributory Factors: One third of total score
- Population Density (population/land area)
- Daily Vehicle Miles Traveled (DVMT)
- Infrastructure Share : Percentage of total accidents involving unusual road condition or traffic control device issue.
- Average Annual Rainfall (in inches)
- Young Drivers (Percentage of population aged 15 – 29)
Data and Sources
- Collision data were sourced from SWITRS and include all records available for 2015. Collision and vehicle mile data reflects usage of local streets in each city and DOES NOT include freeways or unincorporated places.
- DVMT figures were taken from the California Office of Traffic Safety http://www.ots.ca.gov/
- Demographic information was sourced from the United States Census Bureau. https://www.census.gov/
- Precipitation data was provided by U.S. Climate Data http://www.usclimatedata.com

